Alternative Data is growing as a necessary weapon for traders and quantitative investors. Yet there are many barriers to alternative data success.
According to Greenwich Associates, some of the barriers include:
- Data incompatibility
- Poor or ineffective Data Sources
- Human Capital Required
Overcoming Some of these Barriers with Data or Symbology Mapping
Symbology Maps
Every trading firm has some form of symbology map. Most cover the basic use cases for their specific trading. For example, one firm may have maps of Reuters Identification Codes (RICS) to their internally used maps. It is all that firm needs, and therefore that is where most trading firms stop.
Expanding Symbology Maps to Cover the Need of Alternative Data
Data incompatibility for traders and quant researchers begins with understanding the linkage between data sets. The data in the Alternative Dataset most likely is missing the trading symbol that could be used to link the data to the stock market data.
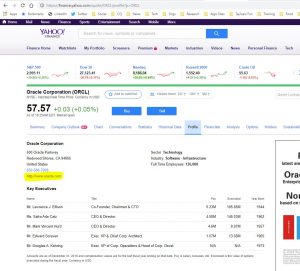
For example, the alternative data may contain a reference to the company name, or to a web site. Consider that your altdata has “www.oracle.com.” The data incompatibility begins with a missing map that takes this URL and maps it to “ORCL,” the trading symbol used by traders. Both the URL and the trading Symbol map to a company name “Oracle Corporation.”
This is a non-traditional Symbology Map.
www.oracle.com = ORCL.
Your alternative data may need other non-standard symbology mappings. Consider some other mappings for example:
- Corporate Officers
- Major Vendors
- Raw Materials
- Financial Analysts
Symbology maps are needed to overcome AltData barriers. They directly address issues with data incompatibility thereby improving ineffective data sources and decreasing the demand on
Building A URL to Symbology Map
The following Python code can be used to build this non-traditional symbol to URL map. This code (written in Python 3) uses web scraping and basic logic to pull the URL from the Yahoo Finance “profile” page/tab to get the URL for a given list of stock symbols.
Keep in mind – If you use a web service like Yahoo Finance make sure you review their terms of service in collecting data from Yahoo (or any other) site. Be fair. Be Ethical.

The code loops through a list of symbols [‘SBUX’, ‘MET’, ‘CAT’, ‘JNJ’, ‘ORCL’] and reads the Yahoo finance page to build a map of symbols to company URL.
import bs4 as BeautifulSoup
from bs4 import SoupStrainer
import re
import urllib.request
import pandas as pd
import requests
symbols = ['SBUX', 'MET', 'CAT', 'JNJ', 'ORCL']
headers = {'User-agent': 'Mozilla/5.0'}
mySymbols = {}
# looping through all my symbols
for s in symbols:
    vals = {}
    #getting the symbol "profile" from Yahoo finance.
    # The url for the stock appears on this page.
    url = ("https://finance.yahoo.com/quote/{}/profile?p={}".format(s,s))
    webpage = requests.get(url, headers=headers)
    soup = BeautifulSoup.BeautifulSoup(webpage.content)
    # the title has the company name but has additional information in the format of
    # (SSS) profile and ....
    # where SSS is the symbol. We remove this extra title to get the company name.
    title = soup.find("title")
    tmp = title.get_text()
    rxTitle = re.compile(r'\(.*$')
    coName = rxTitle.sub("", tmp)
    # looping through all the links in the document.
    # The company web site is the the one that doesn't have yahoo in the reference,
    # and has a blank title.
    for link in soup.find_all('a', href=True):
        try:
            if link['target'] and "" == link['title']:
                m = re.search('yahoo', link['href'], flags=re.IGNORECASE)
                if None == m:
                    url = link['href']
                    webpage = requests.get(url, headers=headers)
                    soup = BeautifulSoup.BeautifulSoup(webpage.content)
                    vals = {"company":coName, "url":link['href']}
                    print (s, vals)
                    mySymbols[s] = vals
        except:
            pass
Output
The output from this portion of the script will produce the console prints.

Console Output is OK, but…
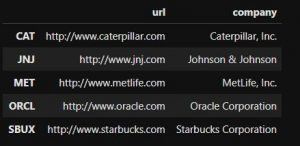
Outputting this data to the console is helpful, mainly to easily see what is happening in my code. But what I really want is a Pandas data frame that will allow me to sort, filter, and save the data into a CSV. To put the collected data map into a dataframe I simply use the following code.
#placing my data into a data frame
df = pd.DataFrame.from_dict(mySymbols, orient = 'index')
df
Dataframe Output


Author: Tayloe Draughon, Senior Product Manager, CloudQuant


