The newly released study authored by CloudQuant Research quantified the strength and uniqueness of Data Vendor’s Earnings Distortion Data — Below are highlights of the findings.
- The dollar-neutral long-short portfolio, using 20-day lagged Data Vendor (“DV”)-based signal, returned 60% over 10 years with a Sharpe Ratio over the last five years of ~1.
- The long-only portfolio outperformed the S&P 500 index by an average of 4% per annum over 10 years and averaged 18.4% per annum.
- Performance of DV-based signals lagged 10-20+ days showed that the market is not incorporating this information into securities prices for many weeks.
- The decomposed returns of the long-short portfolio show that 85% of that total return is alpha.
- This signal is highly novel. We measured a very low correlation between smart-beta ETFs and known risk factors and the long-short portfolio returns.
- When applied to single-stock analysis of Tesla Motors (TSLA), the DV-based signal demonstrated prescience in both long and short positions since its IPO.
- In the case of Under Armour (UAA), DV-based signals showed the ability to detect the beginning and end of the rally that began in 2020. The long signal ended as the share price became range-bound in Q2 and Q3 of 2021.
What Is Earnings Distortion?
Earnings distortions are accounting shenanigans the companies engage in to meet or beat earnings expectations quarter after quarter. Mathematically it can be understood with the equation below.
Reported Earnings =
Core Earnings + Total Earnings Distortion.
Data Vendor
Core Earnings And Earnings Distortion Datasets
CloudQuant Data Vendor provides insights into the fundamentals and valuation of private & public businesses. Combining human financial accounting and reporting expertise with NLP/ML/AI technologies, the firm’s research shines a light in the dark corners (e.g. footnotes, MD&A) of hundreds of thousands of financial filings to unearth critical details that drive uniquely comprehensive and independent debt and equity investment ratings, valuation models and research tools.
CloudQuant found The Earnings Distortion Signals Out-Performed the S&P 500 Index by 4% per Year After Transaction Costs Over 10 years.
“Incorporating this signal into your investment process is like hiring a top-notch team of fundamental analysts for the entire stock market at a fraction of the cost–and it shows in the results we found”, says Morgan Slade, Founder and CEO of CloudQuant.
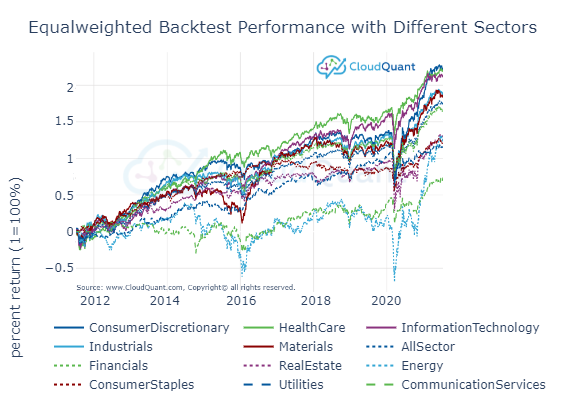
Gross Returns of Long-only US Stock Portfolio Segmented by MSCI GICS Sector demonstrate the broad applicability of the earnings distortion signals to most sectors in the economy.
“The consistent and low correlation of the portfolio across all sectors and smart-beta products demonstrates that these are new investments ideas with no identifiable equivalent.”
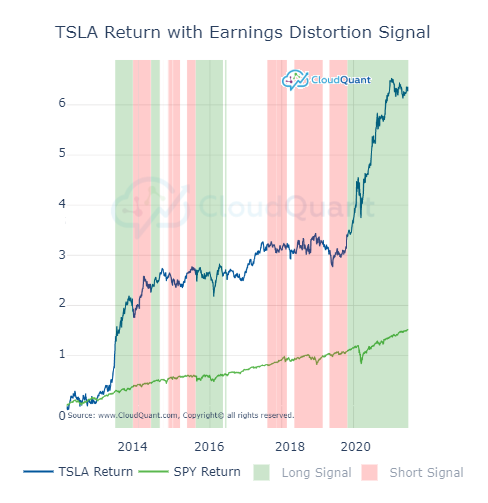
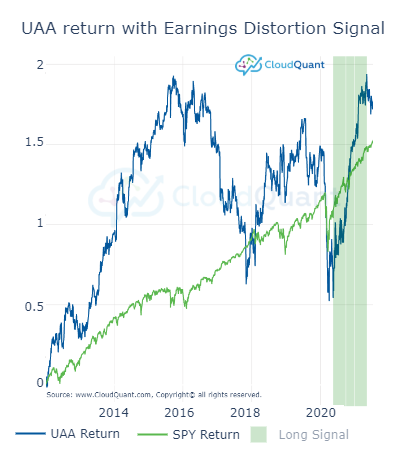
Earning Distortion Signals (20 Days Lag) example for Single Stock of TSLA (top) and UAA (bottom) shows long signals as green shading and short signals as red shading along with cumulative returns of the stock (blue line) and SPY (green line).