Fixing a Tough Memory Leak In Python
A few of our power users reported that long-running backtests would sometimes run out of memory. These power-users are the people who often find new trading strategies and so we wanted to work with them to improve the performance of our backtesting tools. Over the past couple of weeks, our senior engineer found that the problem wasn’t in our code, but in one of the popular Python libraries that we use.
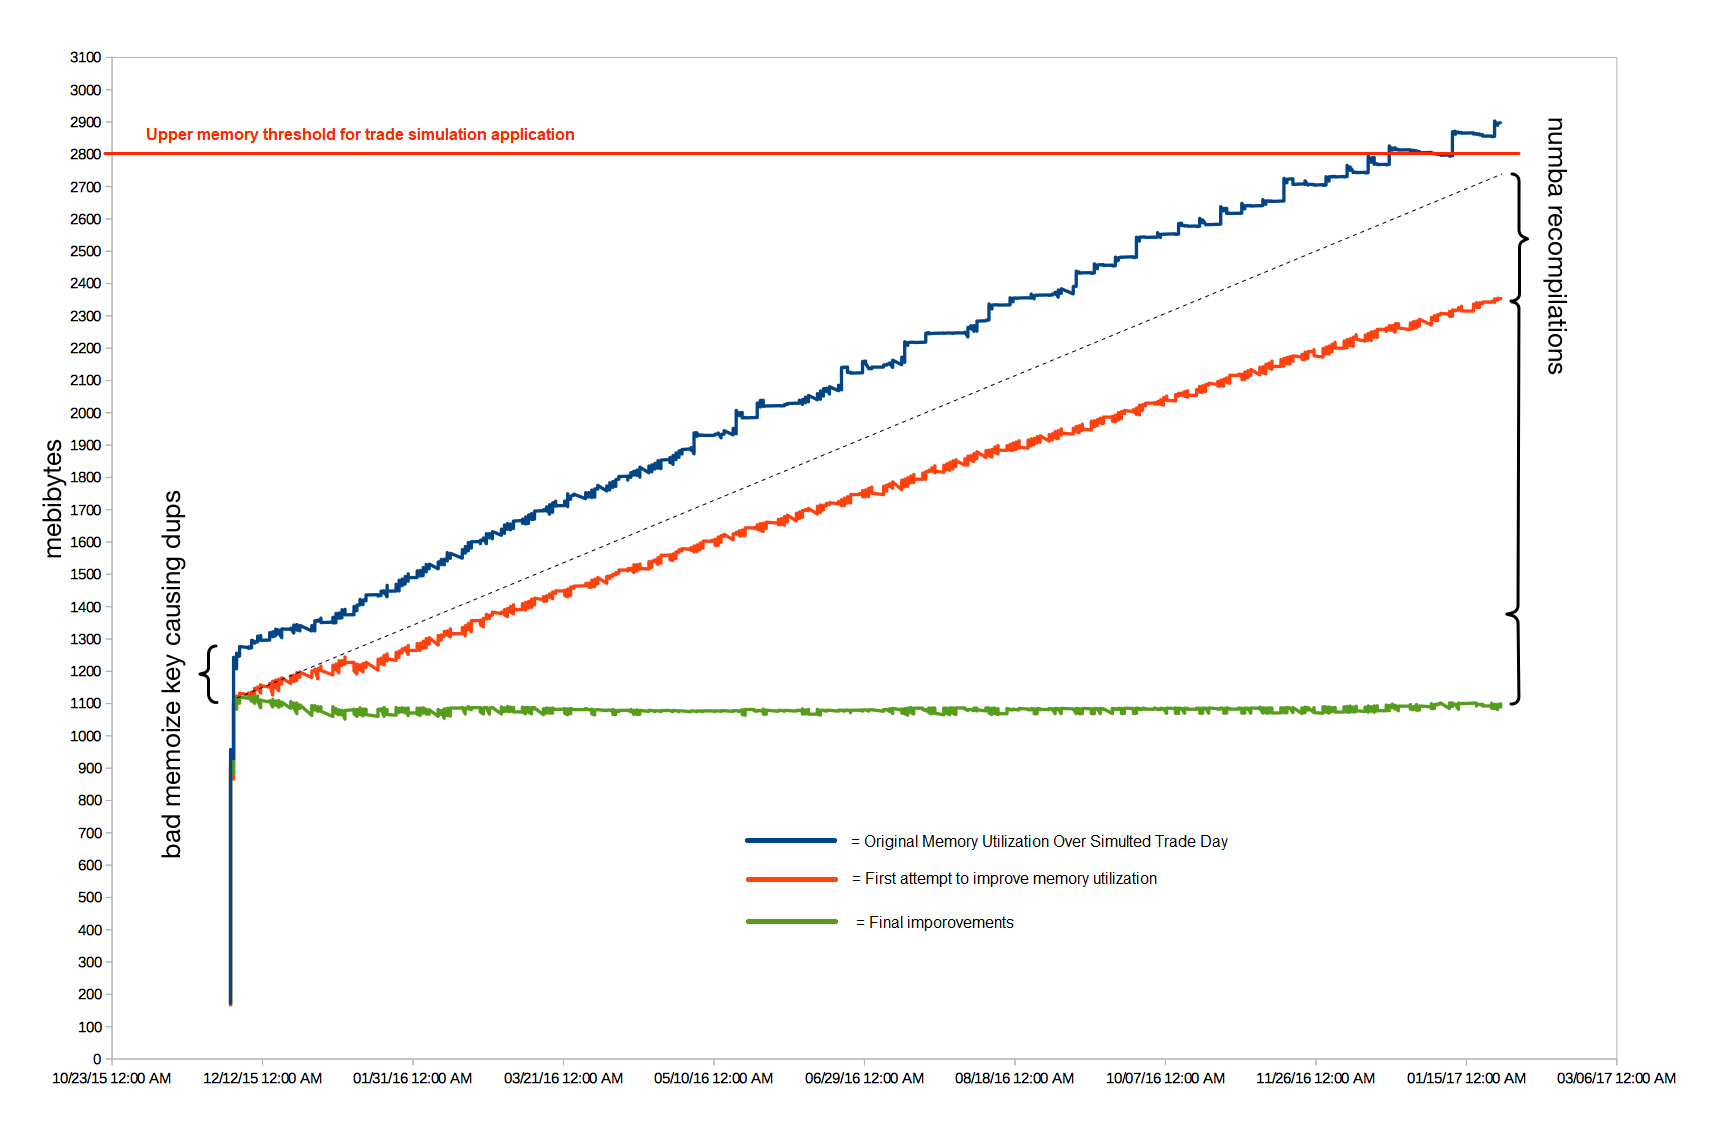
We found the problem in numpy and numba. The leak was ultimately caused by how we were using these libraries. We made the correction and as you can see from the following chart, it really improved the memory utilization for our trade simulator.
The following is the write-up by our senior engineer so that others can learn from our engineering efforts.
Finding Python memory leaks using LD_PRELOAD and libunwind
You have a Python process that is consuming memory for an unintended and unknown reason (“leaking”) and you want to investigate. The process may import extension modules that have memory management issues of their own, outside the Python interpreter. You have access to a Linux environment for debugging.
We will:
- identify the C call stack where memory is allocated, where this memory is not freed in a timely manner
- LD_PRELOAD a custom library to raise a signal when this stack is encountered
- handle the signal in python to dump a python call stack
Identify problematic C call stacks
Since we will be using libunwind in step 2, and to avoid some writing of code, we will use memleax— based on libunwind– to get started.
This utility attaches to a running process and produces a report of C call stacks where the allocation is not matched by a deallocation for a given period of time. If the analysis is still running and a matching deallocation happens eventually (even after the configured interval), the associated call stack is pruned from the interesting results.
An example result:
CallStack[140]: may-leak=9 (22123530 bytes)
    expired=9 (22123530 bytes), free_expired=0 (0 bytes) .... 2458170
    alloc=677 (2020173920 bytes), free=668 (1998050390 bytes)
    freed memory live time: min=1 max=643 average=10
    un-freed memory live time: max=5821
    0x00007fab5318ba80  libc-2.19.so  malloc()+0
    0x00007fab5069fc31  multiarray.so  npy_alloc_cache()+65  numpy/core/src/multiarray/alloc.c:173
    0x00007fab506ee4bf  multiarray.so  PyArray_NewFromDescr_int()+1871  numpy/core/src/multiarray/ctors.c:1041
    0x00007fab506ee5f2  multiarray.so  PyArray_NewFromDescr()+34  numpy/core/src/multiarray/ctors.c:1124
    0x00007fab50765b2e  multiarray.so  array_boolean_subscript()+142  numpy/core/src/multiarray/mapping.c:1007
    0x00007fab50767eae  multiarray.so  array_subscript()+974  numpy/core/src/multiarray/mapping.c:1617
    0x00007fab53edcde3  libpython2.7.so  PyEval_EvalFrameEx()+20019
    0x00007fab53e5faab  libpython2.7.so  gen_send_ex.isra.1()+155
In this result we see that a function “npy_alloc_cache” is allocating memory that is sometimes not being freed. Memleax can be configured to show N items of the call stack. This allows us to see some context. In this case, we see that the call to “npy_alloc_cache” is happening in the context of “array_boolean_subscript.” We can use this to differentiate this leaky call context from others that may call “npy_alloc_cache.”
Log and raise a signal when this call stack is encountered
Now that we have a suspected area of concern, we want to see what is happening in python. We will intercept calls to malloc() and free() which allocate and release memory respectively. When a call to malloc() happens in the context we identified above, we will raise a signal (an OS-level “exception” of sorts) and handle this in Python. We will be sure our symbols/stack matches memleax by using libunwind.
stack_signal.cpp:
// ...
#define UNW_LOCAL_ONLY
#include
// ...
std::set s; // keep track of allocations that have not been freed
std::mutex mut; // protect s
extern "C" {
// LD_PRELOAD will cause the process to call this instead of malloc(3)
void *malloc(size_t size)
{
    // on first call, get a function pointer for malloc(3)
    static void *(*real_malloc)(size_t) = NULL;
    if(!real_malloc)
        real_malloc = (void *(*)(size_t))dlsym(RTLD_NEXT, "malloc");
    assert(real_malloc);
    // call malloc(3)
    void *retval = real_malloc(size);
    static __thread int dont_recurse = 0; // init to zero on first call
    if(dont_recurse)
        return retval;
    dont_recurse=1; // if anything below calls malloc, skip analysis
    // on first call, create cache for symbol at each address
    static thread_local std::map<unw_word_t,std::string> *m = NULL;
    if(!m)
        m = new std::map<unw_word_t,std::string>();
    // collect stack symbols, updating cache as needed
    unw_cursor_t cursor;
    unw_context_t context;
    unw_getcontext(&context);
    unw_init_local(&cursor, &context);
    std::vector trace;
    while (unw_step(&cursor) > 0)
    {
        unw_word_t pc;
        unw_get_reg(&cursor, UNW_REG_IP, &pc);
        if (pc == 0)
            break;
        std::string &str = (*m)[pc];
        if(str=="") // build cache
        {
            unw_word_t offset;
            // started as C, feel free to use std::string/ostringstream
            char sym[1024], line[1024];
            sprintf(line,"0x%lx:", pc);
            if (!unw_get_proc_name(&cursor, sym, sizeof(sym), &offset))
                sprintf(&line[strlen(line)], " (%s+0x%lx)\n",
                        sym, offset);
            else
                sprintf(&line[strlen(line)], " -- no symbol\n");
            str = line;
        }
        trace.push_back(&str);
    }
    // look for our particular stack context
    // - log it
    // - save for free()
    // - raise signal
    if(trace.size() >=4)
    if(strstr(trace[0]->c_str(),"npy_alloc_cache"))
    if(strstr(trace[3]->c_str(),"array_boolean_subscript"))
    {
        fprintf(stderr,"malloc @ %p for %lu\n", retval, size);
        std::lock_guard g(mut);
        s.insert(retval);
        raise(SIGUSR1);
    }
    dont_recurse=0;
    return retval;
}
// report matching free() calls
void free(void *ptr)
{
    static void (*real_free)(void *) = NULL;
    if(!real_free)
        real_free = (void (*)(void *))dlsym(RTLD_NEXT, "free");
    assert(real_free);
    real_free(ptr);
    static __thread int dont_recurse = 0;
    if(dont_recurse)
        return;
    dont_recurse=1;
    mut.lock(); // in case lock_guard would call malloc/free?
    if(s.find(ptr) != s.end())
    {
        fprintf(stderr,"free @ %p\n", ptr);
        s.erase(ptr); // b/c addr will get reused
    }
    mut.unlock(); // before the following line, unlike with lock_guard
    dont_recurse=0;
}
} // extern C
</unw_word_t,std::string></unw_word_t,std::string>
Compile with something like:
g++ -std=c++11 -g -Wall -fPIC -shared -o stack_signal.so \
stack_signal.cpp -ldl -lpthread -lunwind
Run the python:
LD_PRELOAD=./stack_signal.so python my.py # or with -m pdb
You should see output like the following:
malloc @ 0x55c2db93e360 for 36020
malloc @ 0x55c2d9691b30 for 84100
free @ 0x55c2db93e360
free @ 0x55c2d9691b30
In python, handle the signal by printing the (python!) stack
import signal
import traceback
def debug_signal_handler(signal, frame): traceback.print_stack(frame)
signal.signal(signal.SIGUSR1, debug_signal_handler)
Now your “malloc @” log lines should be followed by stacks in your Python code. In this case it identified the following as the caller of “array_boolean_subscript” in cases where “malloc @” log lines don’t have corresponding “free @” log lines:
... = chunk[to_keep] # a section of a numpy array identified by the boolean array
…now that we know where the problem starts
It turned out that the numpy array resulting from the above operation was being passed to a numba generator compiled in “nopython” mode. This generator was not being iterated to completion, which caused the leak. As per the numba documentation, generators must be compiled with forceobj=True in order for the generator finalizer to handle this case. In our case it made sense to add code to ensure that the generator is always iterated to completion, and we retained the “nopython” compilation.
Hopefully, you now have an additional tool at your disposal when confronted with perplexing Python memory leaks! While this methodology applied to this problem could not directly point the finger at numba, it certainly helped to know the line of python where the problem originated.